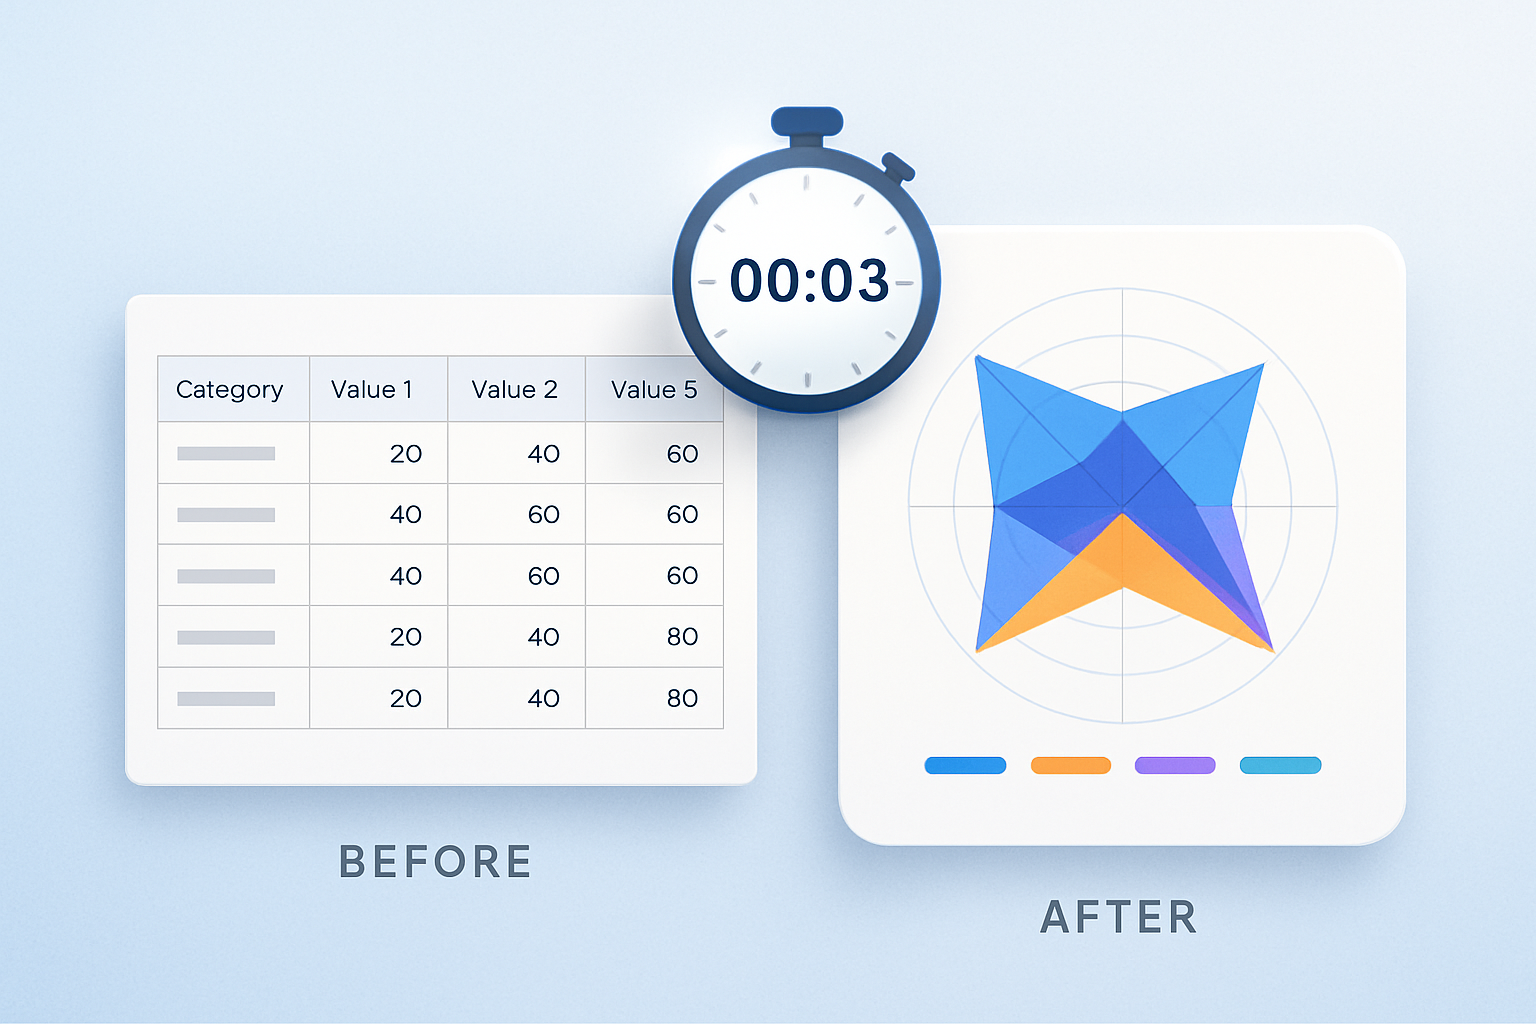
Transform Your Data into Professional Charts in Seconds
VisoChart is a powerful Excel add-in that works across all platforms.
Create stunning visualizations with just a few clicks - no design skills required.
What is VisoChart
VisoChart is a comprehensive Excel add-in that transforms raw data into professional charts across all Excel platforms.
- Cross-Platform SupportWorks seamlessly with Excel Desktop, Excel Online, and Office 365 across Windows, Mac, and web browsers.
- One-Click Chart CreationGenerate professional charts instantly from your Excel data with minimal setup and configuration.
- Professional OutputExport publication-ready charts in multiple formats (PNG, SVG, PDF) for presentations and reports.
Why Choose VisoChart
Save hours of manual chart formatting and create professional visualizations that impress your audience.


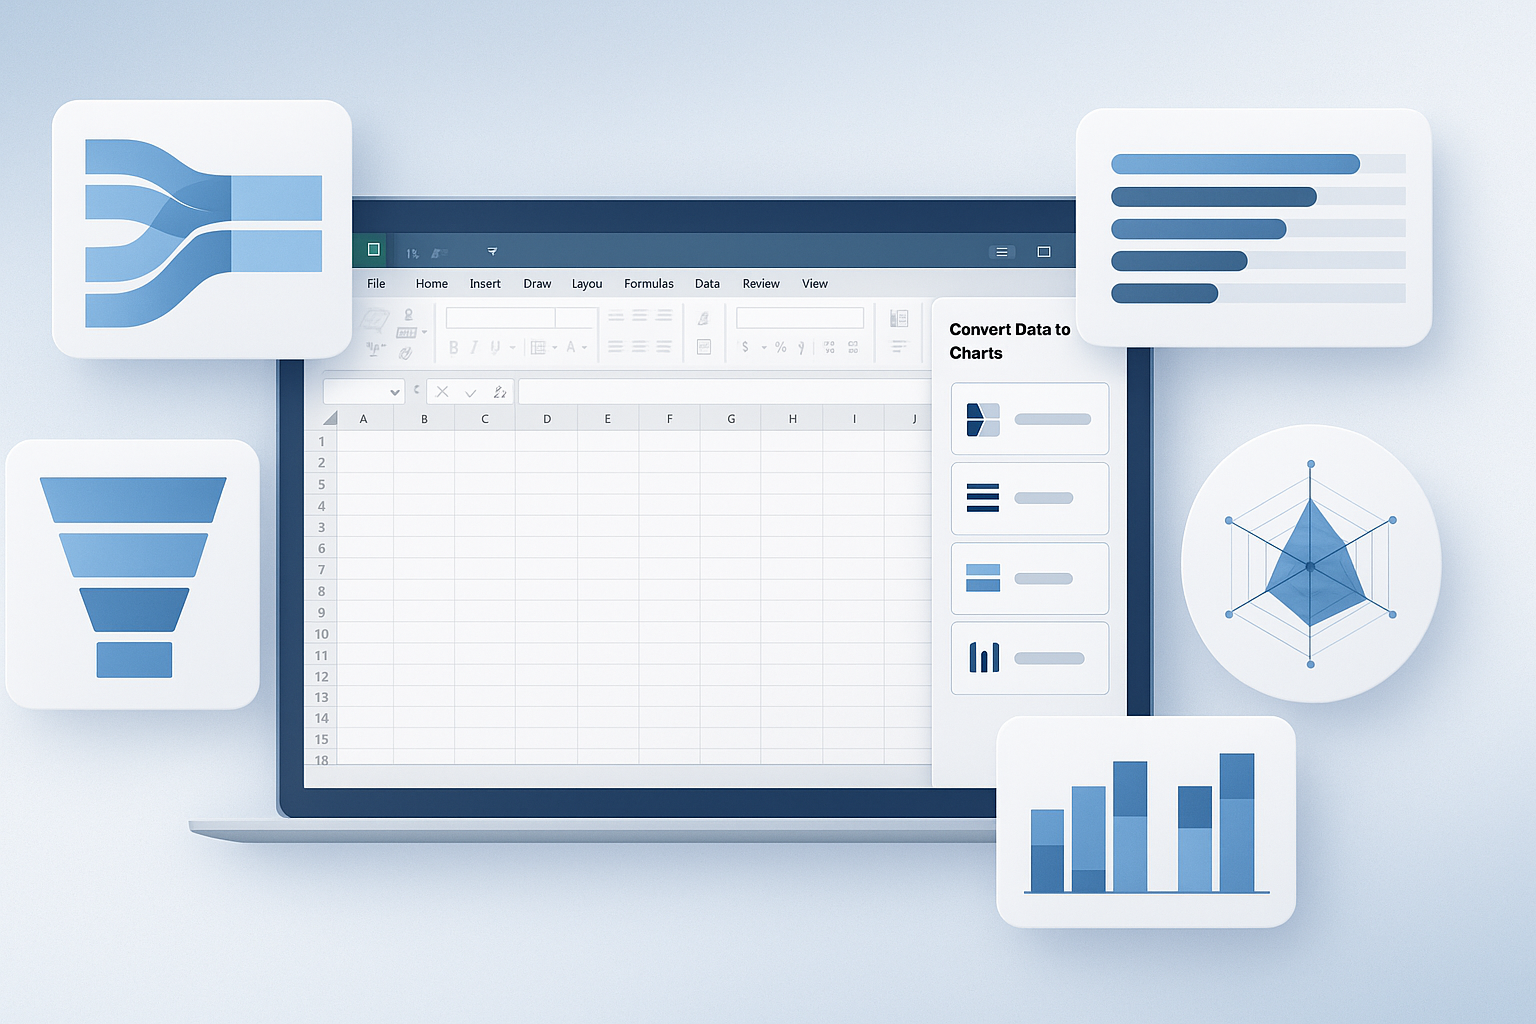
Powerful Features for Every User
Everything you need to create professional data visualizations directly in Excel.
Sankey Diagrams
Visualize flow and relationships between different data points with beautiful Sankey charts.
Likert Scale Charts
Perfect for survey data and opinion analysis with customizable Likert scale visualizations.
Pareto Analysis
Identify the most significant factors in your data with 80/20 Pareto chart analysis.
Radar Charts
Compare multiple variables and dimensions with comprehensive radar/spider chart support.
Comparative Bar Charts
Advanced bar chart configurations for detailed data comparisons and analysis.
Theme Customization
Multiple professional themes and complete color palette customization options.
Frequently Asked Questions
Have questions? Contact us at support@visochart.com
Which Excel versions does VisoChart support?
VisoChart works with Excel 2016 and later, Excel Online, and Office 365. It supports Windows, Mac, and web-based Excel environments.
When will VisoChart be available for download?
We're currently in development and planning a beta release in Q2 2025. Join our waitlist to be notified as soon as it's available.
What chart types will be included in the first release?
The initial release will include Sankey diagrams, Likert scale charts, Pareto analysis, Radar charts, and advanced bar chart configurations with full customization options.
Will there be a free trial or demo version?
Yes! We'll offer a free trial period for all users during the beta phase. Beta testers will also receive special lifetime pricing.
Can I export charts for use in presentations?
Absolutely! VisoChart supports export to PNG, SVG, PDF, and other formats optimized for presentations, reports, and publications.
How does licensing work for teams and organizations?
We'll offer flexible licensing options including individual licenses and volume discounts for teams. Team collaboration features are planned for Q3 2025.
Ready to Transform Your Data Visualization?
Be among the first to experience VisoChart.